![[SoundStage!]](../titles/sslogo3.gif) Home Audio Home Audio Equipment Measurements |
||||
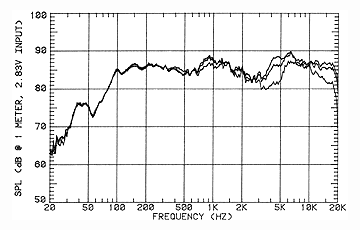
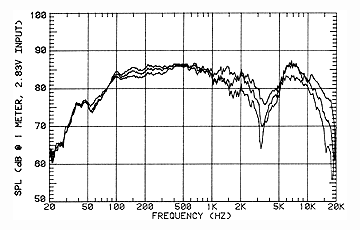
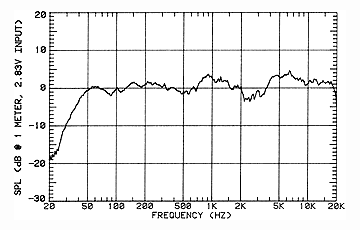
September 2000 Verity Audio Fidelio Loudspeakers: MeasurementsPLEASE NOTE: This loudspeaker has a rear-firing woofer. As a result, the anechoic measurement will be substantially rolled off in the bass region due to the absence of rear-wall reflections. In a listening room, the Fidelio's bass would reflect off the rear wall and be reinforced. Therefore, to give a better indication of the speaker's actual response, we have included an extra frequency-response measurement that is a "splice" of two measurements. The first one used is an on-axis response measured to the front of the cabinet. The second is an on-axis response measured to the rear of the cabinet. Using these two measurements and specialized computer software, the graph was spliced together at 100Hz to form a complete frequency-response graph. All loudspeaker measurements are performed independently at the National Research Council of Canada. Please click to learn more about how we test loudspeakers there. All measurement data, including graphical information displayed below, is the property of SoundStage! Reproduction in any format is not permitted.
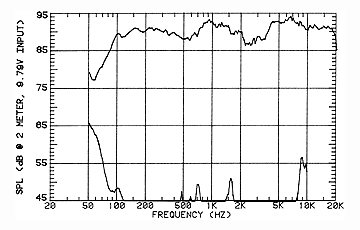
Frequency response,
20Hz - 20kHz (measured @ 2m, plotted @ 1m) Frequency response, 20Hz - 20kHz
(measured @ 2m, plotted @ 1m) Additional
Measurement ("spliced" responsed curves)
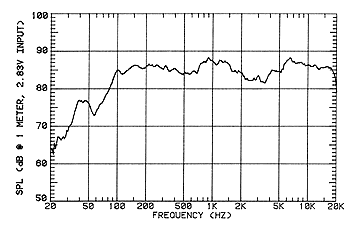
Listening Window,
20Hz - 20kHz (measured @ 2m, plotted @ 1m)
THD+N @ 90dB, 50Hz -
10kHz (measured @ 2m)
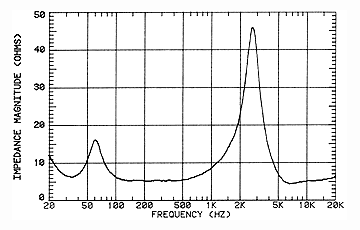
Impedance curve
|
||||
![[SoundStage!]](../titles/sslogo3.gif) All Contents All ContentsCopyright © 2000 SoundStage! All Rights Reserved |
