| This section contains some ancillary
measurements in narrative form. The measurements include gain, signal-to-noise ratio,
AC-line power draw at idle, and output impedance at 50Hz. We measure output impedance by
injecting a constant 1 amp of current with frequency into the output of the integrated
amplifier under test and measuring the resulting voltage developed across the output.
Because the current is 1 amp, the measured voltage is equal to the magnitude of the output
impedance in ohms. This value is checked against the output impedance calculated from the
voltage drops measured in Chart 1 at the 1-watt output level and is generally in good
agreement for the vast majority of tested amplifiers.
The basic measurements of frequency response, power output and distortion,
signal-to-noise ratio, and damping factor are done with a reference input/output condition
of 0.5V input set to produce 5W output into 8 ohm loads by adjustment of the unit’s
volume control. Gain and input sensitivity are
measured with the volume control at full clockwise rotation.
Power output with 1kHz test signal
This section indicates the power
output of the integrated amplifier at 1% and 10% distortion levels and 8-, 4-, and 16-ohm
impedances when the integrated amplifier is driven by a 1kHz test signal. In the case of
tube integrated amplifiers with stated 8-ohm output terminals, the data was taken for that
output. Otherwise, the data is taken on the single pair of output terminals provided. For
solid-state integrated amplifiers, no data is provided for output at 16 ohms; all
well-designed solid-state integrated amps should have no output-related issues at such a
high impedance.
In cases where the 1% and 10%
powers are close together, this generally is indicative of a design with quite a bit of
negative feedback, typical of solid-state integrated amplifiers. Where the 1% and 10%
powers are quite separated, this is typical of tube or solid-state integrated amps with
little or no negative feedback. Generally speaking with the tube integrated amplifiers,
the best load match for lowest distortion is the impedance that gives the highest power at
1% distortion.
General
The main purpose of this section
is to give pertinent details that correspond directly with the charts, to help readers
interpret the visual data. Salient points about the chart results and additional data
measurements are included, along with other pertinent comments on the integrated
amplifier’s behavior.
| Chart 1
- Frequency Response as a
Function of Output Loading |
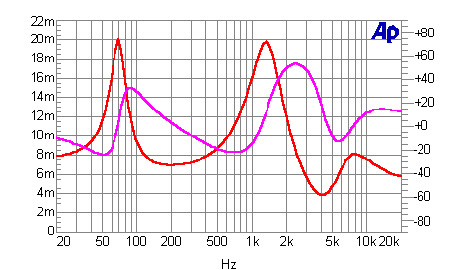
What it tells you: Four measurements can be seen on this
chart: frequency responses with open circuit, 8-ohm load, 4-ohm load, and dummy speaker
loading at the integrated amplifier’s output. For tube integrated amplifiers with
multiple impedance output connections, the 8-ohm output connector is used. The lower the
output impedance, the less the output will change with loading and therefore the flatter
the response delivered to a speaker load. On the chart, the lower the output impedance,
the closer the three resistive loaded curves are to each other on the chart.
| Chart 2 - Distortion as a Function of Power Output and Output Loading |
- Purpose: Shows how the integrated amplifier’s distortion (signal components
in the output not present in the input) varies with amount of output power and output
loading.
What it tells you: Three or four measurements are displayed: 1kHz total harmonic
distortion plus noise vs. power output for 8-,
and 4-ohm resistive loading on the 8-ohm tap for tube integrated amplifiers, plus SMPTE IM
distortion with 8-, and 4-ohm loading on the 8-ohm tap. Typically,
solid-state integrated amplifiers will have low distortion up to the start of clipping
where the amount of distortion will abruptly rise. Tube integrated amplifiers generally
have higher amounts of distortion and merge into clipping more smoothly.
| Chart 3 - Distortion as a Function of Power Output and Frequency |
- Purpose: Illustrates how amplifier distortion varies with frequency.
What it tells you: Four measurements are displayed here: Total harmonic distortion vs.
frequency at four power levels ranging from 1W to a value at or near the rated power of
the integrated amplifier. Output loading is shown for either 4- or 8-ohms, as indicated.
| Chart 4 - Damping Factor
as a Function of Frequency |
- Purpose: Shows how the integrated amplifier's damping factor varies
with frequency.
What it tells you: Damping factor is the value of the output impedance at
a particular frequency divided into 8. With tube integrated amplifiers this measurement is
made on the 8-ohm output tap if available. In a similar manner to Chart 1, this parameter
measures the integrated amplifier’s ability to deliver a flat frequency to the load.
The higher the damping factor -- and the lower the impedance, the two being inverses of
each other -- the flatter the response is into a speaker load. The value of output
impedance at 50Hz is given in the Additional Data section.
| Chart 5 - Distortion and
Noise Spectrum |
- Purpose: Plot of the harmonic distortion spectrum of a 1kHz test signal
at an output power of 10W into an 8-ohm load.
What it tells you: Since the frequency axis is logarithmic, it also
allows a measure of the leakage of power-supply line harmonic frequencies into the
amplifier output. Generally, it is preferable if the signal-frequency harmonics decrease
rapidly after the third harmonic.
|
![[SoundStage!]](titles/sslogo3.gif) Home Audio
Home Audio