January 2002
Redgum Audio
RGM175 Mono Amplifiers: Measurements
All amplifier measurements are performed
independently by BHK Labs. Please click to learn
more about how we test amplifiers there. All measurement data and graphical
information displayed below are the property of SoundStage! and Schneider
Publishing Inc. Reproduction in any format is not permitted.
- Measurements were made with 120V AC line voltage.
- The RGM175 comes with a non-detachable passive preamplifier
section. Signal input was into an input of the passive preamp section with the volume
control at maximum unless otherwise noted.
- Power output plotted with one channel driven (one of two
power amplifer sections were available for measurements. Since both power amplifier
channels are separately powered from the AC line, performance would be slightly different
with both channels powered and operating).
- Gain: 41.9x, 32.4dB.
- Output noise, 8-ohm load, 1k-ohm input termination, volume
control set for 1W/8 ohms with 1kHz 50mV input signal: wideband 0.220mV, -82.2 dBW; A
weighted 0.053mV, -94.5 dBW.
- AC line current draw at idle: 0.2A.
- Output impedance (measured by an injection of a constant 1A
of current at 50Hz): 0.01 ohms.
- This amplifier does not invert polarity.
Power output with 1kHz test signal
- 8-ohm load at 1% THD: 160W
- 8-ohm load at 10% THD: 200W
- 4-ohm load at 1% THD: 205W
- 4-ohm load at 10% THD: 250W
General
This amplifier
design has a non-flat frequency response with some low- and high-frequency boost. The
output impedance is very low and, consequently, no difference can be seen in Chart 1 in
the audio band with an open circuit, 8-ohm, and 4-ohm output loading. This low output
impedance translates into the high damping factor, shown in Chart 4. Output power at the
onset of clipping is about 150 to 200W with 8- and 4-ohm loading. Due to the low output
stage idling current and consequent AC power draw, there is some crossover-type distortion
and non-related signal asymmetry as evidenced by the rich series of odd and even harmonics
of the 10W/4-ohm 1kHz spectrum shown in Chart 5.
| Chart 1
- Frequency Response of Output Voltage as a Function of Output Loading |
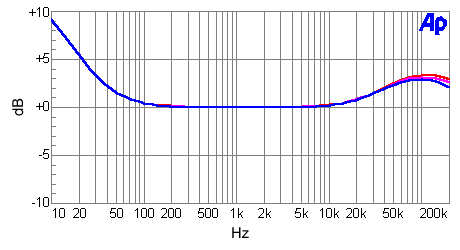
Red line: open circuit
Magenta line: 8-ohm load
Blue line: 4-ohm load
| Chart 2 - Distortion as a Function
of Power Output and Output Loading |
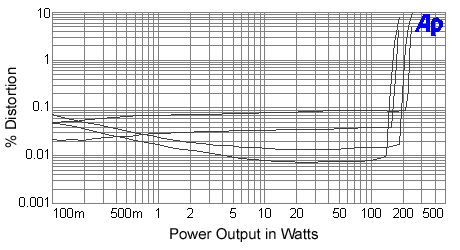
(line up at 10W to determine lines)
Top line: 4-ohm SMPTE IM
Second line: 8-ohm SMPTE IM
Third line: 4-ohm THD+N
Bottom line: 8-ohm THD+N
| Chart 3 - Distortion
as a Function of Power Output and Frequency |
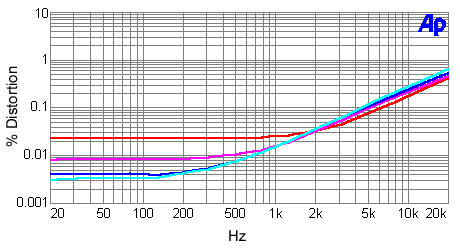
4-ohm output loading
Cyan line: 1W
Blue line: 10W
Magenta line: 60W
Red line: 180W
| Chart 4 - Damping Factor
as a Function of Frequency |
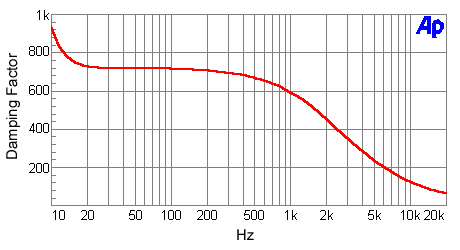
Damping factor = output impedance divided into 8
| Chart 5 - Distortion and
Noise Spectrum |
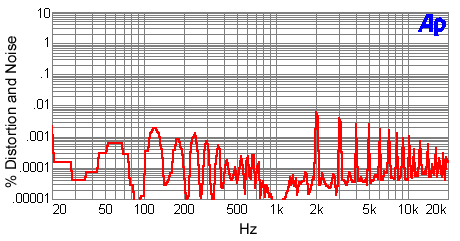
1kHz signal at 10W into a 4-ohm load
|
![[SoundStage!]](../titles/sslogo3.gif) Home Audio
Home Audio ![[SoundStage!]](../titles/sslogo3.gif) All Contents
All Contents


