April 2003
Lamm Industries
ML1.1 Mono Amplifiers: Measurements
All amplifier measurements are performed
independently by BHK Labs. Please click to learn
more about how we test amplifiers there. All measurement data and graphical
information displayed below are the property of SoundStage! and Schneider
Publishing Inc. Reproduction in any format is not permitted.
- Measurements were made with 120V AC line voltage.
- Power output and distortion plotted with one channel driven
(this is a mono amplifier).
- Gain: 21.2x, 26.5dB.
- Output noise, 8-ohm load, unbalanced input, 1k-ohm input
termination: wideband 0.122mV, -87.3dBW; A weighted 0.045mV, -96.0dBW.
- AC line current draw at idle: 1.9A.
- Output impedance at 50Hz: 1.08 ohms.
- This amplifier does not invert polarity.
Power output with 1kHz test signal
- 8-ohm load at 1% THD: 42W
- 8-ohm load at 10% THD: 110W
- 4-ohm load at 1% THD: 13W
- 4-ohm load at 10% THD: 130W
- 16-ohm load at 1% THD: 62W
- 16-ohm load at 10% THD: 72W
General
The Lamm ML1.1 is an upgraded version of the ML1, with
simplified bias and balance adjustments. Two meters and associated screwdriver controls
are used to set the total plate current and balance. The idling current as received, set
up, and warmed up, was the nominal design 300mA and the balance was zero. Neither control
was adjusted during the measurement period.
Measurements were made using the unbalanced RCA input and
an 8-ohm load on the 8-ohm output connectors. Performance using the balanced XLR input was
the same. Frequency response, as seen in Chart 1, is beautifully controlled in the
high-frequency end as a function of load. The low-frequency response holds up down to 10Hz
nicely at the 1W level of the test. Output impedance is typical of many tube amplifiers
giving less than plus-and-minus 1dB frequency-response variation with the NHT dummy
speaker load. Total harmonic distortion plus noise as a function of power output and load
for a test frequency of 1kHz is plotted in Chart 2. Also shown in this chart is the SMPTE
IM distortion for an 8-ohm load. Total harmonic distortion plus noise as a function of
frequency at several power levels is plotted in Chart 3 for an 8-ohm load. Admirable is
the relatively low amount of distortion increase at the higher frequencies, which is a
hallmark of Vladimir Lamm’s design philsophy. Damping factor vs. frequency referred
to an 8-ohm load is plotted in Chart 4, and is between 7 and 8 over most of the audio
range. In the spectral plot of distortion and noise for a 10W 1kHz signal into an 8-ohm
load on the 8-ohm output, the signal distortion components are dominated by the second and
third harmonics with higher-order harmonics at reduced and decreasing amplitude with
frequency. Although the main hum components are very low in this amplifier, there are some
120Hz power-supply ripple component sidebands around the surpressed 1kHz fundamental test
frequency.
| Chart 1
- Frequency Response of Output Voltage as a Function of Output Loading |
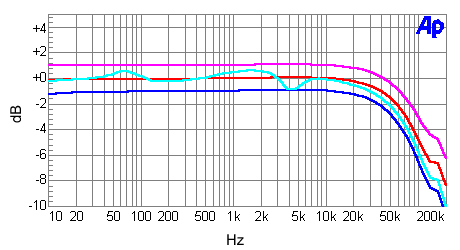
Magenta line: open circuit
Red line: 8-ohm load
Blue line: 4-ohm load
Cyan line: NHT dummy-speaker load
| Chart 2 - Distortion as a Function
of Power Output and Output Loading |
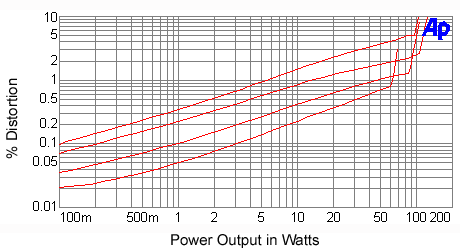
(line up at 5W to determine lines)
Top line: 8-ohm SMPTE IM
Second line: 4-ohm THD+N
Third line: 8-ohm THD+N
Bottom line: 16-ohm THD+N
| Chart 3 - Distortion
as a Function of Power Output and Frequency |
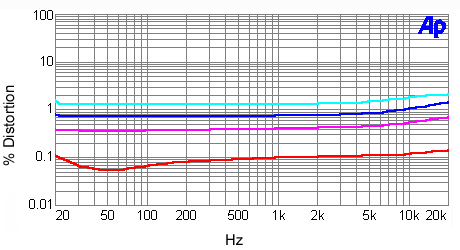
8-ohm output loading
Cyan line: 80W
Blue line: 30W
Magenta line: 10W
Red line: 1W
| Chart 4 - Damping Factor
as a Function of Frequency |
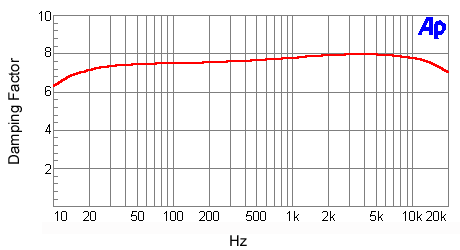
Damping factor = output impedance divided into 8
| Chart 5 - Distortion and
Noise Spectrum |
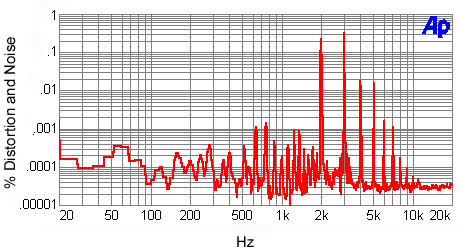
1kHz signal at 10W into an 8-ohm load
|
![[SoundStage!]](../titles/sslogo3.gif) Home Audio
Home Audio ![[SoundStage!]](../titles/sslogo3.gif) All Contents
All Contents


