November 2002
Opera Consonance
Reference 9.9A Mono Amplifiers: Measurements
All amplifier measurements are performed
independently by BHK Labs. Please click to learn
more about how we test amplifiers there. All measurement data and graphical
information displayed below are the property of SoundStage! and Schneider
Publishing Inc. Reproduction in any format is not permitted.
- Measurements were made with 120V AC line voltage.
- Gain: 14.9x, 23.5dB.
- Output noise, 8-ohm load: wideband 1.33mV, -66.5dBW; A
weighted 0.110mV, -88.2dBW.
- AC line current draw at idle: 1.36A.
- Output impedance (measured by an injection of a constant 1A
of current at 50Hz): 2.86 ohms.
- This amplifier inverts polarity.
Power output with 1kHz test signal
- 8-ohm load at 1% THD: 10W
- 8-ohm load at 10% THD: 22W
- 4-ohm load at 1% THD: 1.8W
- 4-ohm load at 10% THD: 17W
- 16-ohm load at 1% THD: 13W
- 16-ohm load at 10% THD: 18W
General
The Reference 9.9A SET (single-ended triode) amplifier
measured here is typical of a design utilizing the venerable 845 output tube. Frequency
response, as seen in Chart 1, rolls off at both ends of the audio range and there is some
pronounced ultrasonic aberrations, likely due to the characteristics of the output
transformer. Output impedance is moderate giving an approximate plus and minus 2dB
frequency-response variation on the NHT dummy speaker load. Total harmonic distortion plus
noise as a function of power output for a test frequency of 1kHz is plotted in Chart 2. It
shows that the amount of distortion at the 1kHz test frequency is reasonably low at less
than 1% up to 10W output for the 8-ohm load on the 8-ohm output (and measures similarly
for a 4-ohm load on the 4-ohm output). However, loading the 8 ohm output with 4 ohm or 16
ohm load raises or lowers the distortion considerably. Total harmonic distortion plus
noise as a function of frequency at several power levels is plotted in Chart 3. Amount of
distortion over the main midrange energy band is less than 1-2% for power outputs of 10W
or less. However, distortion does rise considerable at both ends of the audio range.
Damping factor versus frequency shown in Chart 4 is a modest 2.5 over the middle range of
frequencies, and actually increases a bit at the frequency extremes. Not surprisingly, on
the 4-ohm output, the damping factor was about double. In the spectral plot of distortion
and noise for a 10W 1kHz signal into an 8-ohm load on the 8-ohm output (Chart 5), the
signal distortion components are dominated by the second and third harmonics with the
higher-order products tailing off rapidly. There are some 120Hz sidebands around the
nulled out fundamental along with a fairly high amount of AC line hum harmonic
frequencies. The amount of wideband noise of over 1mV would likely be audible on speakers
with efficiencies of 90dB or more.
| Chart 1
- Frequency Response of Output Voltage as a Function of Output Loading |
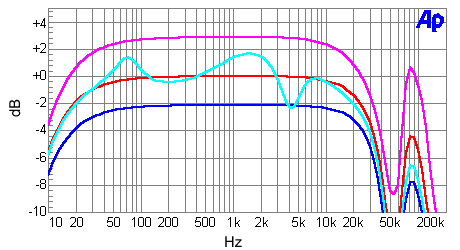
Magenta line: open circuit
Red line: 8-ohm load
Blue line: 4-ohm load
Cyan line: NHT dummy speaker load
| Chart 2 - Distortion as a Function
of Power Output and Output Loading |
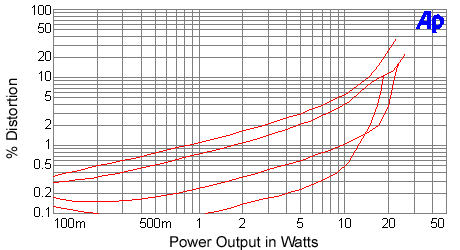
(line up at 10W to determine lines)
Top line: 8-ohm SMPTE IM
Second line: 4-ohm THD+N
Third line: 8-ohm THD+N
Bottom line (red): 16-ohm THD+N
| Chart 3 - Distortion
as a Function of Power Output and Frequency |
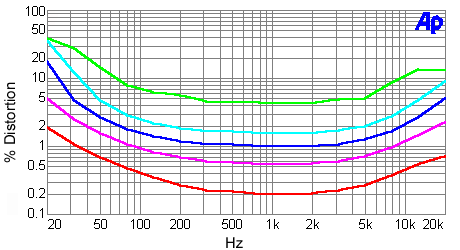
8-ohm output loading
Green line: 20W
Cyan line: 15W
Blue line: 10W
Magenta line: 5W
Red line: 1W
| Chart 4 - Damping Factor
as a Function of Frequency |
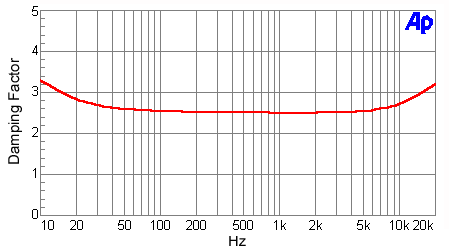
Damping factor = output impedance divided into 8
| Chart 5 - Distortion and
Noise Spectrum |
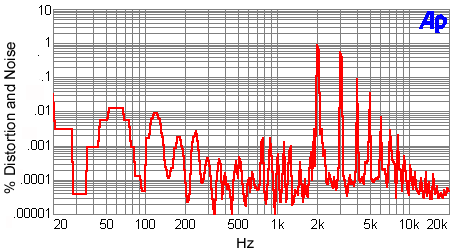
1kHz signal at 10W into an 8-ohm load
|
![[SoundStage!]](../titles/sslogo3.gif) Home Audio
Home Audio ![[SoundStage!]](../titles/sslogo3.gif) All Contents
All Contents


