April 2007
Conrad-Johnson
PV15 Preamplifier: Measurements
All preamplifier measurements are performed
independently by BHK Labs. Please click to
learn more about how we test preamplifiers there. All measurement data, including
graphical information displayed below, is the property of SoundStage! and
Schneider Publishing Inc. Reproduction in any format is not permitted.
- Measurements were made at 120V AC line voltage.
- This preamplifier section inverts polarity; the phono
section does not invert polarity.
- AC line current draw
- Standby: 0.05A
- Operate: 0.38A
- Input impedance at 1kHz:
- Line section = 14.3k ohms
- Phono section = 47k ohms
- Output impedance at 1kHz:
- Line section = 95 ohms
- Phono section (at fixed outputs) = 715 ohms
- Gain, line section:
- Instrument loading, Lch/Rch = 25.9X, 28.3dB / 26.2X, 28.4dB
- IHF loading, Lch/Rch = 25.6X, 28.2dB / 26.0X, 28.3dB
- Gain, phono section (at 1kHz):
- Instrument loading, Lch/Rch = 105.3X, 40.4dB / 103.4X,
40.3dB
- IHF loading, Lch/Rch = 98.2X, 39.8dB / 96.3X, 39.7dB
- IHF sensitivity:
- Line section, Lch/Rch = 19.5mV / 19.2mV
- Phono section (at 1kHz), Lch/Rch = 5.1mV / 5.2mV
- Line section output noise versus bandwidth and
volume-control position, 1kHz input termination:
- Volume clockwise, Lch/Rch, wideband | A weighted =
0.55uV / 0.54uV | 0.22uV / 0.21uV
- Volume at unity gain, Lch/Rch, wideband | A weighted =
0.15uV / 0.13uV | 0.027uV / 0.026uV
- Volume at "one click up" from counterclockwise
(mute), Lch/Rch, wideband | A weighted =
0.14uV / 0.12uV | 0.026uV / 0.026uV
- Phono-referred input noise, 1kHz source:
- Wideband, Lch/Rch = 12.7uV / 12.2uV
- A weighted, Lch/Rch = 0.57uV / 0.61uV
- Phono overload at 1kHz: 86mV (1% THD+N)
General
The Conrad-Johnson PV15 line-level preamp utilizes a
miniature 8080 tube in each channel. The PV15 also has an optional tube phono stage. The
tubes used in the phono stage are the more familiar 12AX7 types. I suspect there is a
MOSFET output buffer stage in the line section as the output impedance is too low for a
simple tube line-stage circuit. The PV15 is chock-full of Conrad-Johnson’s
proprietary white film capacitors in the power supply and signal circuitry.
Chart 1 shows the frequency response of the PV15 with the
volume control set for unity gain and for instrument and IHF loading. Both channels are
shown. With the IHF load, the high-frequency response starts to tip up a bit above 100kHz
and the low-frequency end starts to roll off due to the size of the output coupling
capacitors and the relation to the 10kHz IHF loading. Generally, this preamp’s
high-frequency response is at worst at full volume and gets better as the volume is turned
down.
At full gain, with the volume fully up, Chart 2A shows the
most high-frequency roll-off. With the volume control set at an attenuation of about
-50dB, which is about 20dB below unity gain, a likely listening setting of the volume
control, the response is much flatter, as shown in chart 2B. Volume-control tracking
between channels was amazingly good, being within 0.1dB down to –80dB attenuation.
Chart 3 shows how THD+N (total harmonic distortion plus
noise) varies as a function of preamp output level with the IHF load and with the volume
control set for unity gain. The 20kHz distortion is a little more than for 20Hz and 1kHz.
With the instrument load, the distortion vs. frequency curves were virtually the same. As
I have said numerous times in these commentaries, having a constant amount of distortion
versus frequency at all operating levels is a mark of a good circuit.
With the volume control again set for unity gain, a plot of
the 1kHz distortion and noise spectrum at 0.5V output is shown in Chart 4. Results for
this test were about the same for instrument or IHF loading.
Since this preamp has no tone controls, there is no Chart 5
to display the tone-control characteristics.
RIAA equalization error for the phono preamp is plotted in
Chart 6. The data is for both channels and for instrument and IHF loading at the EPL
(external processor loop) output.
Phono THD+N vs. output voltage and frequency is shown in
Chart 7 for instrument loading. Amount of distortion is quite a bit higher at 20kHz than
at 10Hz and 1kHz.
| Chart 1 - Frequency
Response at Unity Gain with IHF and Instrument Loading |

IHF loading
Magenta line = left channel
Cyan line = right channel
Instrument loading
Red line = left channel
Blue line = right channel
| Chart 2 - Frequency Response as a
Function of Volume Control Setting |
Chart 2A - volume at
"full up"
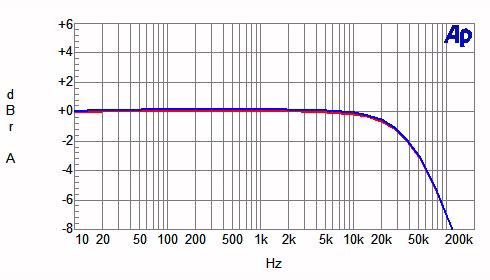
Instrument loading
Red line = left channel
Blue line = right channel
Chart 2B - volume set to -51dB relative to
"full up"
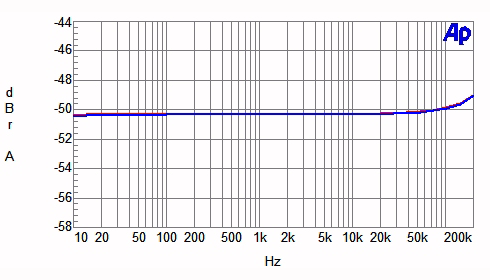
Instrument loading
Red line = left channel
Blue line = right channel
| Chart 3 - Distortion
as a Function of Output Voltage and Frequency |
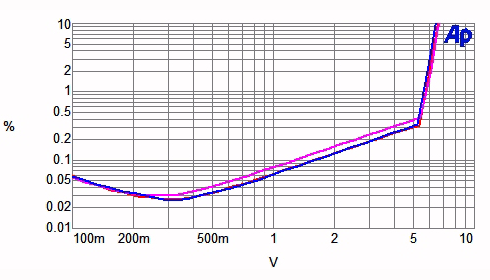
Instrument loading
Magenta line = 20kHz
Blue line = 1kHz
Red line = 20Hz
| Chart 4 - Distortion and
Noise Spectrum |
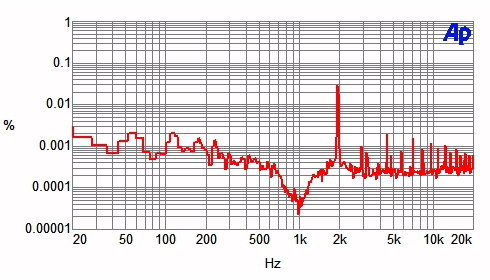
IHF loading
Red line = spectrum of 1kHz test signal distortion and AC-line harmonics at 0.5V input and
output at 0.5V.
| Chart 6 - Phono-Stage RIAA Equalization
Error |
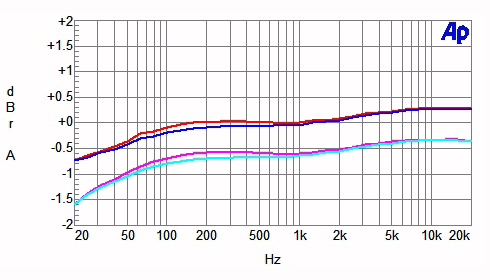
Instrument loading (upper lines)
Red line = left channel
Blue line = right channel
IHF loading (lower lines)
Magenta line = left channel
Cyan line = right channel
| Chart 7 - Phono-Stage Distortion vs.
Frequency and Output |
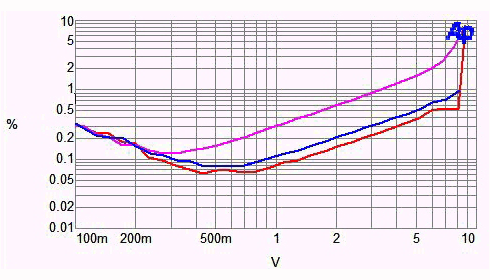
Instrument loading
Magenta line = 20kHz
Red line = 1kHz
Blue line = 20Hz
|
![[SoundStage!]](../../titles/sslogo3.gif) Home Audio
Home Audio ![[SoundStage!]](../../titles/sslogo3.gif) All Contents
All Contents


