September 2006
Aurum Acoustics
Integris CDP CD Player/Preamplifier: Measurements
All preamplifier measurements are performed
independently by BHK Labs. Please click to
learn more about how we test preamplifiers there. All measurement data, including
graphical information displayed below, is the property of SoundStage! and
Schneider Publishing Inc. Reproduction in any format is not permitted.
Please note: Although the Integris CDP is a
combination CD player and preamplifier, these measurements were performed only on
the preamplifier section.
- Measurements were made at 120V AC line voltage. Measurements
made on the left channel unless otherwise noted.
- Unity gain for instrument loading and balanced I/O is
"9.0dBu" and for unbalanced I/O is "8.0dBu" on front-panel display.
- This preamplifier does not invert polarity.
- AC line current draw
- Standby: 0.14A
- Operate: 0.17A
- Input impedance at 1kHz:
- Unbalanced input = 9k ohms
- Balanced input = 21k ohms
- Output impedance at 1kHz:
- Unbalanced output = 75 ohms
- Balanced output = 150 ohms
- Gain, balanced I/O, volume at maximum:
- Instrument loading, Lch/Rch = 3.65X, 11.3dB / 3.65X, 11.3dB
- IHF loading, Lch/Rch = 3.59X, 11.1dB / 3.60X, 11.2dB
- Gain, unbalanced I/O, volume at maximum:
- Instrument loading, Lch/Rch = 3.95X, 11.9dB / 3.94X, 11.9dB
- IHF loading, Lch/Rch = 3.92X, 11.9dB / 3.91X, 11.8dB
- IHF Sensitivity, input volts for standard IHF output of
0.5V, IHF loading:
- Balanced I/O, Lch/Rch = 139.3mV / 138.9mV
- Unbalanced I/O, Lch/Rch = 127.6mV / 127.9mV
- Output noise versus bandwidth and volume-control position:
- Balanced output, at maximum, Lch | Rch, wideband/A
weighted =
496.4uV / 14.7uV | 458.6uV / 14.7uV
- Balanced output, at unity gain, Lch | Rch, wideband/A
weighted =
268.5uV / 6.06uV | 260.3uV / 6.12uV
- Balanced output, at typical listening level (20dB below
unity gain), Lch | Rch, wideband/A weighted =
230.8uV / 3.25uV | 225.0uV / 3.13uV
- Unbalanced output, at maximum, Lch | Rch, wideband/A
weighted =
975.4uV / 37.4uV | 894.3uV / 37.7uV
- Balanced output, at unity gain, Lch | Rch, wideband/A
weighted =
331.4uV / 12.0uV | 301.3uV / 12.3uV
- Balanced output, at typical listening level (20dB below
unity gain), Lch | Rch, wideband/A weighted =
234.8uV / 5.57uV | 196.2uV / 5.39uV
General
The Aurum Acoustics Integris CDP CD player/preamplifier is
a flexible component allowing both analog and digital I/O, in addition to playing Red Book
CDs.
Chart 1A shows the frequency response in the unbalanced I/O
mode with the volume control set for unity gain for 0.5V input with instrument and IHF
loading. The closest front-panel gain setting for this is 8.0dBu. In this chart, both
channels are shown. The effect of the IHF loading is pretty negligible. The two channels
are tracking with 0.05dB at this point on the volume control.
Chart 1B is for the balanced I/O mode. Here, because the
output impedance is about twice as high, the loading effect of the IHF load is more
noticeable. In the balanced I/O mode, the closest front-panel gain setting is 9.0dBu. The
bandwidth of this unit (as defined by the -3dB points) is less than 10Hz to over 200kHz.
Furthermore, the frequency response did not change noticeably with the volume set to
maximum, or down to the minimum setting before mute. Therefore, there is no Chart 2
figures showing how frequency response changes with volume-control setting. Volume-control
tracking between channels was better than 0.5dB over the whole range. This is excellent
performance indeed.
Chart 3A shows how total harmonic distortion varies with
input level and frequency for both IHF and instrument loading in the unbalanced I/O mode.
Again, we have a design in which the distortion vs. level is virtually the same for
frequencies from 20Hz-20kHz with instrument and IHF loading. (For clarity, the data shown
is for the left channel and instrument loading.)
Chart 3B shows the same things for the balanced I/O mode.
A spectrum of the distortion and noise residual of a 1kHz
test tone at 0.5V output with IHF loading is plotted in Chart 4 for the unbalanced I/O
mode. AC-line hum harmonics here are very low. The signal-frequency harmonics consist of a
dominant third harmonic and a lower-level second harmonic.
| Chart 1 - Frequency
Response at Unity Gain with IHF and Instrument Loading |
Chart 1A - Unbalanced I/O
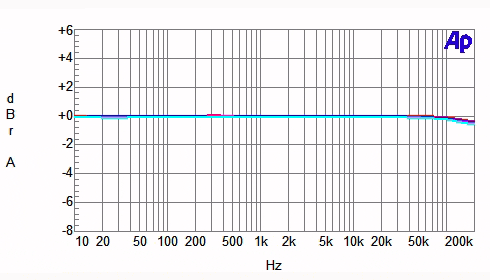
Both channels shown with instrument and IHF loading.
(Resolution of graph prevents showing differences.)
Chart 1B - Balanced I/O
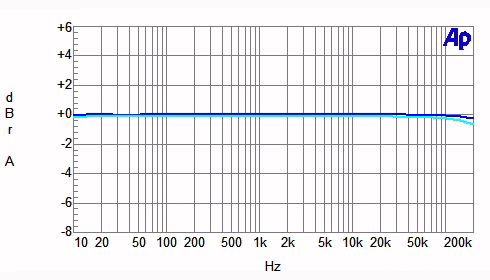
Both channels shown with instrument and IHF loading.
Blue line = instrument loading
Cyan line = IHF loading
| Chart 3 - Distortion
as a Function of Output Voltage and Frequency |
Chart 3A - Unbalanced I/O
Blue line = 20Hz, 1kHz
Magenta = 20kHz
Chart 3B - Balanced I/O
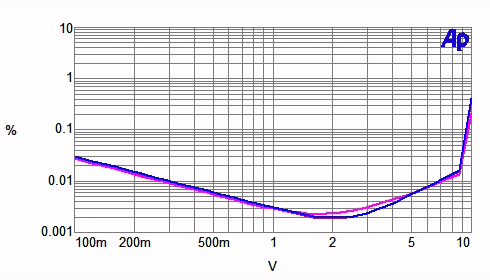
Blue line = 20Hz, 1kHz
Magenta = 20kHz
| Chart 4 - Distortion and
Noise Spectrum |
Chart 4 - Unbalanced I/O
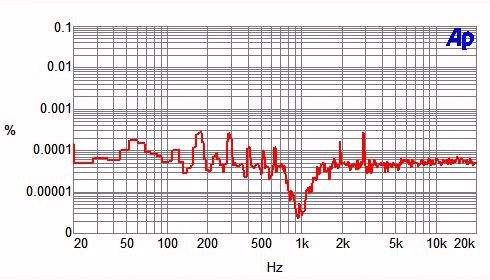
Instrument loading
Red line = spectrum of 1kHz test signal distortion and AC-line harmonics at 0.5V input and
output at unity gain.
|
![[SoundStage!]](../../titles/sslogo3.gif) Home Audio
Home Audio