March 2006
Audio Research
Reference 3 Preamplifier: Measurements
All preamplifier measurements are performed
independently by BHK Labs. Please click to
learn more about how we test preamplifiers there. All measurement data, including
graphical information displayed below, is the property of SoundStage! and
Schneider Publishing Inc. Reproduction in any format is not permitted.
- Measurements were made at 120V AC line voltage. Measurements
made on the left channel and with balanced input and output connections unless otherwise
noted.
- Unity gain for instrument loading and balanced I/O is
"80" and for unbalanced I/O is "93" on front-panel display.
- This preamplifier does not invert polarity.
- AC line current draw
- Standby: 0.03A
- Operate: 1.32A
- Input impedance at 1kHz:
- Unbalanced input = 52k ohms
- Balanced input = 108k ohms
- Output impedance at 1kHz:
- Unbalanced output = 320 ohms
- Balanced output = 660 ohms
- Gain, balanced I/O, volume at maximum:
- Instrument loading, Lch/Rch = 3.52X, 10.9dB / 3.30X, 10.4dB
- IHF loading, Lch/Rch = 3.50X, 10.9dB / 3.27X, 10.3dB
- Gain, unbalanced I/O, volume at maximum:
- Instrument loading, Lch/Rch = 1.77X, 5.0dB / 1.74X, 4.8dB
- IHF loading, Lch/Rch = 1.71X, 4.7 dB / 1.68X, 4.5 dB
- IHF Sensitivity, input volts for standard IHF output of
0.5V, IHF loading:
- Balanced I/O, Lch/Rch = 143mV / 153mV
- Unbalanced I/O, Lch/Rch = 292mV / 298mV
- Output noise versus bandwidth and volume-control position:
- Balanced output, at maximum (103), Lch | Rch,
wideband/A weighted =
56.7uV / 9.5uV | 88.8uV / 10.3uV
- Balanced output, at unity gain (80), Lch | Rch, wideband/A
weighted =
114.2uV / 11.9uV | 164.3uV / 12.7uV
- Balanced output, at typical listening level (20dB below
unity gain (34)), Lch | Rch, wideband/A weighted =
48.2uV / 8.7uV | 68.7uV / 9.7uV
- Unbalanced output, at maximum (103), Lch | Rch,
wideband/A weighted =
320uV / 36.0uV | 224uV / 35.7uV
- Unbalanced output, at unity gain (93), Lch | Rch,
wideband/A weighted =
338uV / 37.4uV | 255uV / 36.2uV
- Unbalanced output, at typical listening level (20dB below
unity gain (53)), Lch | Rch, wideband/A weighted =
341uV / 36.2uV | 243uV / 34.7uV
General
The Audio Research Reference 3 line-level preamplifier is
the newest version of the Reference series of tube preamplifiers. A physically large but
not particularly heavy unit, it features balanced and unbalanced connections for all
inputs and outputs. The front-panel display is large and easy to read from across the room
-- a very nice feature. The setting of volume to known reference numbers via the
front-panel display is now a reality --- much nicer than the earlier reference units,
where volume setting was by guess and by God.
Chart 1 shows the frequency response with the volume
control set for unity gain for 0.5V input with instrument and IHF loading and balanced
I/O. The two channels are tracking within 0.12dB at this point on the volume control. The
bandwidth at this volume setting (as defined by the -3dB points) is less than 10Hz to
about 80kHz. Note: with the IHF loading, there is some low-frequency attenuation starting
to show due to the size of the output coupling capacitors and their low-frequency cutoff
frequency against the 10k of the IHF load.
Now, as with most preamplifiers, especially tube designs,
the high-frequency response is usually some function of the volume-control setting. In
Charts 2A and B the frequency response of the preamp is shown for both channels with the
volume at maximum and at a typical listening position, set at 20dB below unity gain. For
these volume settings, the high-frequency bandwidth is about 200kHz. In Chart 2C, for
volume set for 40dB below unity gain, the HF bandwidth is even wider yet. And at the last
volume position, 1, before mute, the high-frequency response actually starts to boost
being up some 5-6dB at 200kHz. Volume-control tracking is very good over the working
range, generally being better than 0.2dB. The frequency-response behavior with unbalanced
I/O (not shown) is essentially the same.
Chart 3A shows how total harmonic distortion varies with
input level and frequency for both IHF and instrument loading for balanced I/O and unity
gain. The IHF loading has a bit more distortion, but, like the instrument loading, the
distortion is essentially independent of frequency. Charts 3B and 3C illustrate how
distortion varies with level and frequency for unbalanced I/O connections. In these
charts, 20Hz and 1kHz are essentially the same and overlaid, but the 20kHz distortion is a
bit more.
A spectrum of the distortion and noise residual of a 1kHz
test tone at 0.5V output at unity gain with instrument loading is plotted in Chart 4A and
4B for unbalanced and balanced I/O, respectively. The unbalanced I/O condition seems to
have a low-frequency rise compared to the balanced I/O case. Furthermore, the overall
noise level is lower in the balanced I/O mode. Hum harmonics are typical in level for
other preamps measured. The dominant signal harmonic is the second for both I/O
conditions.
| Chart 1 - Frequency
Response at Unity Gain with IHF and Instrument Loading |

IHF loading
Blue line = left channel
Cyan line = right channel
Instrument loading
Red line = left channel
Magenta line = right channel
| Chart 2 - Frequency Response as a
Function of Volume Control Setting |
Chart 2A - gain at maximum
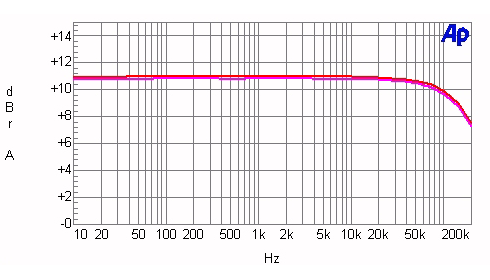
Instrument loading
Red line = left channel
Magenta line = right channel
Chart 2B - gain at -20dB below unity gain
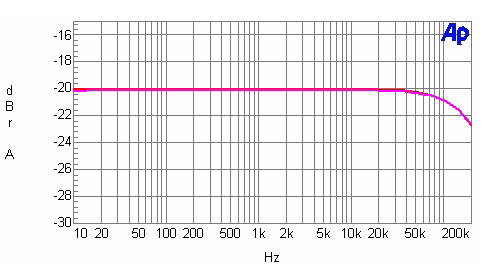
Instrument loading
Red line = left channel
Magenta line = right channel
Chart 2C - gain at -40dB below unity gain
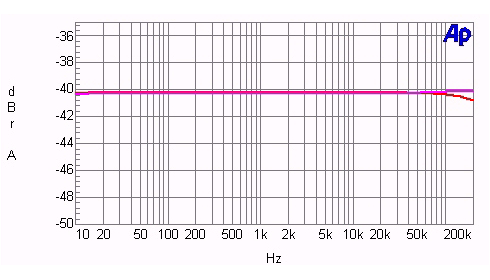
Instrument loading
Red line = left channel
Magenta line = right channel
| Chart 3 - Distortion
as a Function of Output Voltage and Frequency |
Chart 3A - Balanced I/O
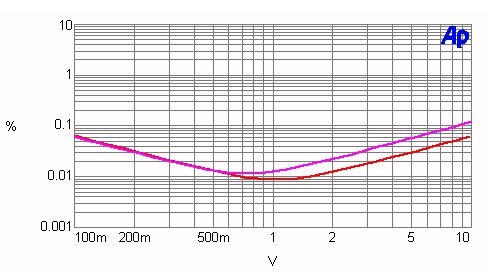
Red line = Instrument loading (20Hz, 1kHz, and 20kHz)
Magenta = IHF loading (20Hz, 1kHz, and 20kHz)
Chart 3B - Unbalanced I/O
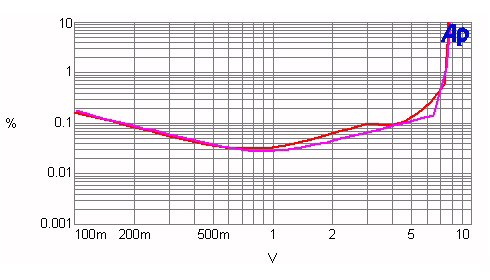
Instrument loading
Magenta line = 20Hz and 1kHz
Red line = 20kHz
Chart 3C - Unbalanced I/O
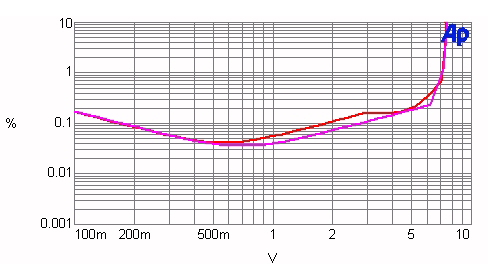
IHF loading
Magenta line = 20Hz and and 1kHz
Red line = 20kHz
| Chart 4 - Distortion and
Noise Spectrum |
Chart 4A - Unbalanced I/O
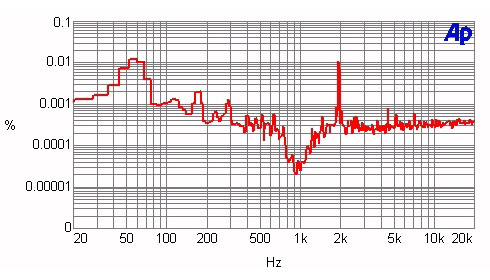
Instrument loading
Red line = spectrum of 1kHz test signal distortion and AC-line harmonics at 0.5V input and
output at unity gain.
Chart 4B - Balanced I/O
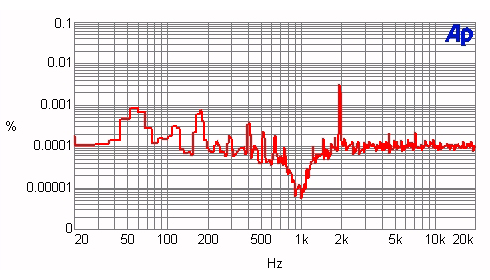
Instrument loading
Red line = spectrum of 1kHz test-signal distortion and AC-line harmonics at 0.5V input and
output
|
![[SoundStage!]](../titles/sslogo3.gif) Home Audio
Home Audio ![[SoundStage!]](../titles/sslogo3.gif) All Contents
All Contents


