April 2010
Bel Canto Design
e.One REF500M Mono Amplifiers: Measurements
All amplifier measurements are performed
independently by BHK Labs. Please click to learn
more about how we test amplifiers there. All measurement data and graphical
information displayed below are the property of SoundStage! and Schneider
Publishing Inc. Reproduction in any format is not permitted.
- Measurements were made at 120V AC line voltage and on the
unit with serial number R5-021. The Balanced input was used unless otherwise noted. The
Audio Precision Aux-0025 low-pass filter was used on all measurements except for frequency
response.
- This amplifier does not invert polarity.
- AC line current draw at idle: 0.22A, 11.5W, 0.45PF.
- Input impedance @ 1kHz:
- Balanced input: 197k ohms.
- Unbalanced input: 91k ohms.
- Output impedance at 50Hz: 0.034 ohm.
- Input sensitivity for 1W output in 8 ohms, volume at
maximum:
- Balanced input: 129mV.
- Unbalanced input: 129mV.
- Gain (8-ohm load):
- Balanced input: 21.9X, 26.8dB
- Unbalanced input: 22.0X, 26.8dB
- Output noise, 8-ohm load, balanced input, 600-ohm input
termination:
- Wideband, ~500kHz bandwidth: 1.63V, -4.8dBW
- With AP Aux-0025 low-pass filter:
- Wideband: 1.8mV, -63.9dBW
- A weighted: 0.055mV, -94.2dBW
- Output noise, 8-ohm load, unbalanced input, 1k-ohm input
termination:
- Wideband, ~500kHz bandwidth: 1.63V, -4.8dBW
- With AP Aux-0025 low-pass filter:
- Wideband: 1.8 mV, -63.9dBW
- A weighted: 0.064mV, -92.9dBW
Power output with a 1kHz test signal
- 8-ohm load at 1% THD: 235W
- 8-ohm load at 10% THD: 291W
- 4-ohm load at 1% THD: 424W
- 4-ohm load at 10% THD: 533W
General
The Bel Canto REF500 utilizes a new ICEpower 125ASX2 stereo
amplifier module strapped in mono-bridge mode. This unit, like recent previous models,
places an extra rectifier and filter capacitor circuit ahead of the AC input to the
ICEpower module. A sophisticated front end op-amp circuit delivers low-noise, equal
out-of-phase signals to the ICEpower module’s input for both unbalanced and balanced
signals.
Chart 1 shows the frequency response of the amp with
varying loads. The high-frequency response is approximately 100kHz, depending on load. As
usual with the ICEpower modules, the high-frequency response with varying loads is kept to
reasonable tolerances with the exception of the open-circuit condition which does peak up
a bit at about 90kHz.
Chart 2 illustrates how total harmonic distortion plus
noise vs. power varies for 1kHz and SMPTE IM test signals and amplifier output load. The
THD+N is quite low over the power range, but the IM distortion is, not unusually, quite a
bit higher.
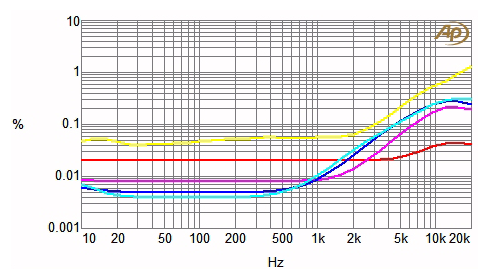
Total harmonic distortion plus noise as a function of
frequency at several different power levels is plotted in Chart 3. The amount of rise in
distortion at high frequencies is quite high in this design.
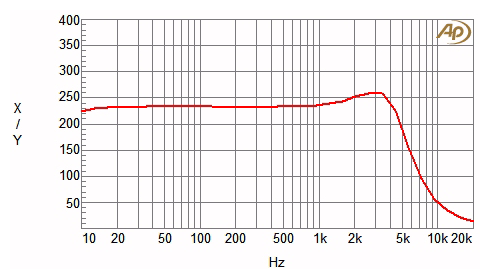
Damping factor vs. frequency is shown in Chart 4 and is
reasonably high and constant over much of the audio range and starts to decrease above
about 4kHz, higher than most linear solid-state power amplifiers.
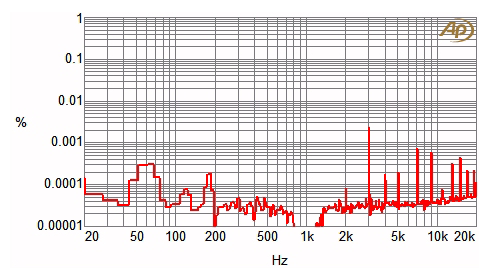
A spectrum of the harmonic distortion and noise residue of
a 10W 1kHz test signal is plotted in Chart 5. The magnitude of the AC line harmonics are
quite low and simple while intermodulation components of line harmonics with signal
harmonics are quite absent. Signal harmonics consist of a dominant third order and a
miscellany of higher-order terms.
| Chart 1
- Frequency Response of Output Voltage as a Function of Output Loading |

Red line: open circuit
Magenta line: 8-ohm load
Blue line: 4-ohm load
Cyan line: NHT dummy-speaker load
| Chart 2 - Distortion as a Function
of Power Output and Output Loading |

(line up at 20W to determine lines)
Top line: 4-ohm SMPTE IM
Second line: 8-ohm SMPTE IM
Third line: 4-ohm THD+N
Bottom line: 8-ohm THD+N
| Chart 3 - Distortion
as a Function of Power Output and Frequency |

4-ohm output loading
Yellow line: 400W
Cyan line: 200W
Blue line: 60W
Magenta line: 10W
Red line: 1W
| Chart 4 - Damping Factor
as a Function of Frequency |

Damping factor = output impedance divided into 8
| Chart 5 - Distortion and
Noise Spectrum |

1kHz signal at 10W into a 4-ohm load
|
![[SoundStage!]](../../titles/sslogo3.gif) Home Audio
Home Audio ![[SoundStage!]](../../titles/sslogo3.gif) All Contents
All Contents


